Floats, Figures, and Tables
Contents
Figures
To add a figure, use the following basic syntax:
{#fig:scientific_universe}For example,
.
](img/1024px-the_scientific_universe.png){#fig:scientific_universe}produces:
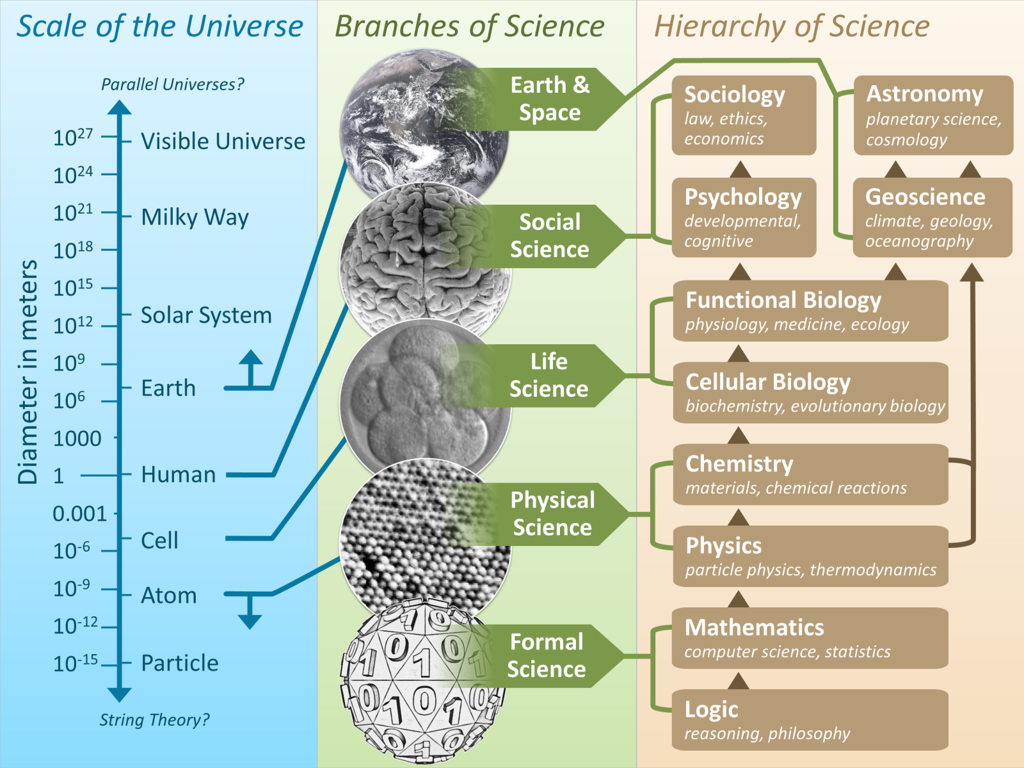
Figure 1 shows some cool things.
Lorem ipsum dolor sit amet, duo ut putant verear, nam ut brute utroque. Officiis qualisque conceptam te duo, eu vim soluta numquam, has ut aliquip accusamus. Probo aliquam pri id. Mutat singulis ad vis, eam euismod pertinax an, ea tale volumus vel. At porro soleat est. Debet facilis admodum an sed, at falli feugiat est.
Ne nonumy quodsi petentium vix, mel ad errem accusata periculis. Porro urbanitas consetetur mei eu, his nisl officiis ei. Ei cum fugit graece, ne qui tantas qualisque voluptaria. Vis ut laoreet euripidis, vix aeque omittam at, vix no cetero volumus. Per te omnium volutpat torquatos, cu vis sumo decore. Eirmod hendrerit an pri.
Another example:
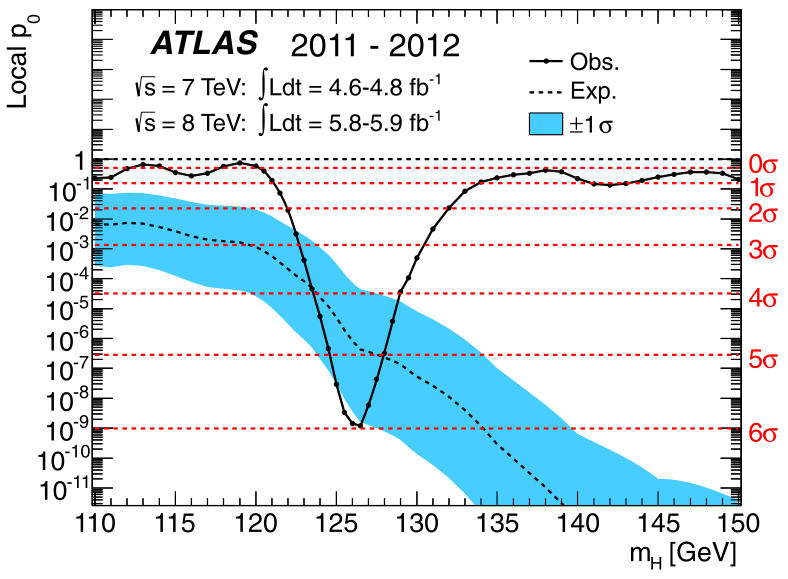
![The observed (solid) local $p_{0}$ as a function of $m_{H}$ in the low mass range.
    The dashed curve shows the expected local $p_{0}$ under the hypothesis of a
    SM Higgs boson signal at that mass with its $\pm{}1\sigma$ band.
    The horizontal dashed lines indicate the $p$-values corresponding to significances
    of 1 to 6$\sigma$\ [@ATLAS_2012_Observation_of_a_new_particle_in_the_search]\.
    ](img/ATLAS-local-p0-vs-mH.png){#fig:ATLAS_local_p0_vs_mH}
produces:
You can refer to labeled figuers like this:
[@fig:ATLAS_local_p0_vs_mH] shows the $p_{0}$ value as a function of the reconstructed
Higgs mass from the ATLAS experiment.
Figure 2 shows the \(p_{0}\) value as a function of the reconstructed Higgs mass from the ATLAS experiment.
Tables
The basic syntax for a table is:
Table: Approximate number of readout channels per sub-detector in ATLAS for the primary sub-detectors (ignoring the minbias trigger system, luminosity monitors, and DCS sensors) [@ATLAS_2008_The_ATLAS_Experiment_at_the_CERN_Large_Hadron]. {#tbl:atlas_channels}

| System                | Subsystem     |  Approx. channels |
|:----------------------|:--------------|------------------:|
| Inner detector        | Pixels        |              80 M |
|                       | SCT           |             6.3 M |
|                       | TRT           |             350 k |
| EM Calorimeter        | LAr barrel    |             110 k |
|                       | LAr end-cap   |              64 k |
| Hadronic Calorimeter  | Tile barrel   |             9.8 k |
|                       | LAr end-cap   |             5.6 k |
|                       | LAr forward   |             3.5 k |
| Muon spectrometer     | MDTs          |             350 k |
|                       | CSCs          |              31 k |
|                       | RPCs          |             370 k |
|                       | TGCs          |             320 k |
| Total                 |               |              88 M |
which produces:
| System | Subsystem | Approx. channels |
|---|---|---|
| Inner detector | Pixels | 80 M |
| SCT | 6.3 M | |
| TRT | 350 k | |
| EM Calorimeter | LAr barrel | 110 k |
| LAr end-cap | 64 k | |
| Hadronic Calorimeter | Tile barrel | 9.8 k |
| LAr end-cap | 5.6 k | |
| LAr forward | 3.5 k | |
| Muon spectrometer | MDTs | 350 k |
| CSCs | 31 k | |
| RPCs | 370 k | |
| TGCs | 320 k | |
| Total | 88 M |
Refer to tables like this:
[@tbl:atlas_channels] shows some cool things too.Table 1 shows some cool things too.
Table of contents per html page
To insert a table of contents for a single html page, add the following line to the Markdown, probably near the top of the page as is done for this one.
<!-- PAGETOC -->Clickmore
You can hide parts of a document in a heading that needs to be clicked to show more by making a div of class clickmore and a div of class more, linked to eachother like this:
<div class="clickmore"><a id="link:test1" class="closed" onclick="toggle_more('test1')">Click for more details</a></div>
<div id="test1" class="more">

Lorem ipsum dolor sit amet, duo ut putant verear, nam ut brute utroque.
Officiis qualisque conceptam te duo, eu vim soluta numquam, has ut aliquip
accusamus. Probo aliquam pri id. Mutat singulis ad vis, eam euismod pertinax
an, ea tale volumus vel. At porro soleat est. Debet facilis admodum an sed,
at falli feugiat est.

...

</div>
For example:
Lorem ipsum dolor sit amet, duo ut putant verear, nam ut brute utroque. Officiis qualisque conceptam te duo, eu vim soluta numquam, has ut aliquip accusamus. Probo aliquam pri id. Mutat singulis ad vis, eam euismod pertinax an, ea tale volumus vel. At porro soleat est. Debet facilis admodum an sed, at falli feugiat est.
Ne nonumy quodsi petentium vix, mel ad errem accusata periculis. Porro urbanitas consetetur mei eu, his nisl officiis ei. Ei cum fugit graece, ne qui tantas qualisque voluptaria. Vis ut laoreet euripidis, vix aeque omittam at, vix no cetero volumus. Per te omnium volutpat torquatos, cu vis sumo decore. Eirmod hendrerit an pri.
PlotTable
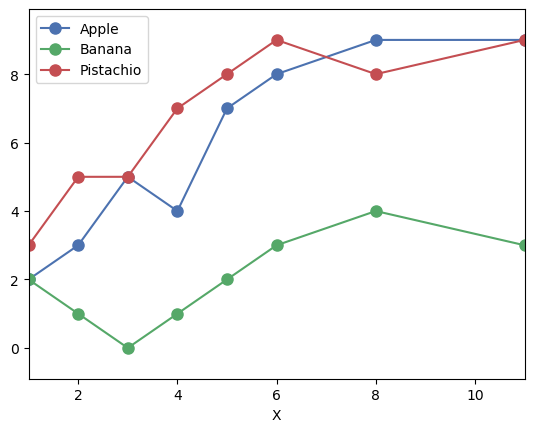
Here, we show a PlotTable, where the user can specify a table, and a corresponding figure plotting the data in the table is automatically generated.
For example:
PlotTable: My caption {#tbl:plot_table}

|    X |  Apple |  Banana | Pistachio |
|-----:|-------:|--------:|----------:|
|    1 |      2 |       2 |         3 |
|    2 |      3 |       1 |         5 |
|    3 |      5 |       0 |         5 |
|    4 |      4 |       1 |         7 |
|    5 |      7 |       2 |         8 |
|    6 |      8 |       3 |         9 |
|    8 |      9 |       4 |         8 |
|   11 |      9 |       3 |         9 |
makes Figure 3 and Table 2.
| X | Apple | Banana | Pistachio |
|---|---|---|---|
| 1 | 2 | 2 | 3 |
| 2 | 3 | 1 | 5 |
| 3 | 5 | 0 | 5 |
| 4 | 4 | 1 | 7 |
| 5 | 7 | 2 | 8 |
| 6 | 8 | 3 | 9 |
| 8 | 9 | 4 | 8 |
| 11 | 9 | 3 | 9 |
References
University of California, Santa Cruz / ryan.reece@gmail.com / http://rreece.github.io↩︎
Joe University, Joeville / jane@joe.edu / http://jane.joe.edu↩︎