5 Figures and Tables
5.1 Figures
To add a figure, use the following basic syntax:
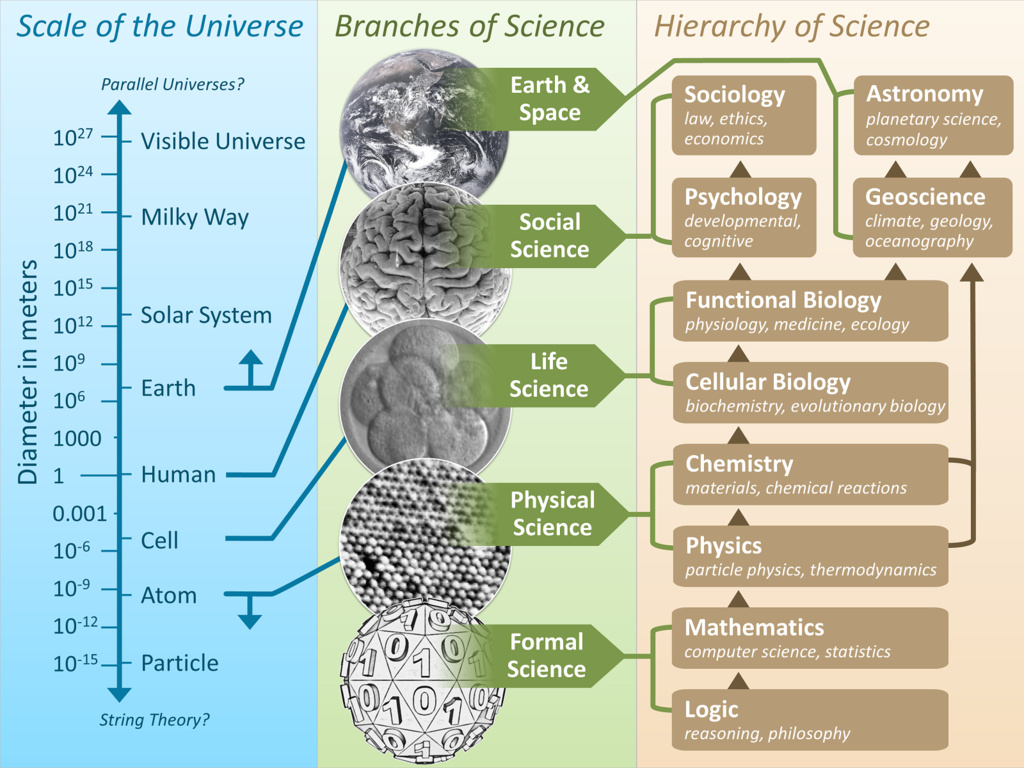
{#fig-scientific-universe}For example,
.
](img/1024px-the-scientific-universe.png){#fig-scientific-universe}produces Figure 5.1.
Lorem ipsum dolor sit amet, duo ut putant verear, nam ut brute utroque. Officiis qualisque conceptam te duo, eu vim soluta numquam, has ut aliquip accusamus. Probo aliquam pri id. Mutat singulis ad vis, eam euismod pertinax an, ea tale volumus vel. At porro soleat est. Debet facilis admodum an sed, at falli feugiat est.
Ne nonumy quodsi petentium vix, mel ad errem accusata periculis. Porro urbanitas consetetur mei eu, his nisl officiis ei. Ei cum fugit graece, ne qui tantas qualisque voluptaria. Vis ut laoreet euripidis, vix aeque omittam at, vix no cetero volumus. Per te omnium volutpat torquatos, cu vis sumo decore. Eirmod hendrerit an pri.
Another example:
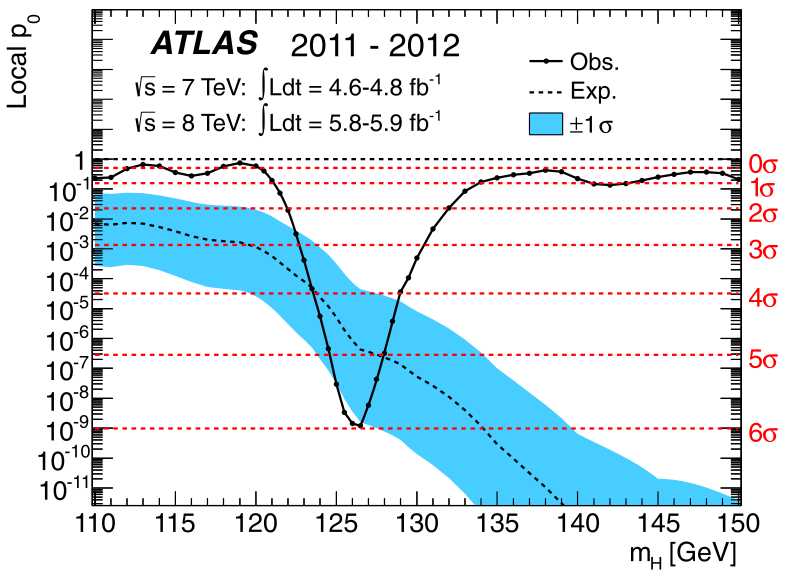
![The observed (solid) local $p_{0}$ as a function of $m_{H}$ in the low mass range.
    The dashed curve shows the expected local $p_{0}$ under the hypothesis of a
    SM Higgs boson signal at that mass with its $\pm{}1\sigma$ band.
    The horizontal dashed lines indicate the $p$-values corresponding to significances
    of 1 to 6$\sigma$\ [@ATLAS_2012_Observation_of_a_new_particle_in_the_search]\.
    ](img/ATLAS-local-p0-vs-mH){#fig-ATLAS-local-p0-vs-mH}
produces Figure 5.2.
Note that by leaving the file suffix implied, img/ATLAS-local-p0-vs-mH, quarto will automatically pick the available png or jpg when producing html output, but will prefer an available pdf figure when producing pdf. 1
1 This allows us to include vector graphics images in pdf format when producing pdf output, whereas when producing html, we use rasterized formats: jpg or pdf.
You can refer to labeled figures like this:
@fig-ATLAS-local-p0-vs-mH shows the $p_{0}$ value as a function of the reconstructed
Higgs mass from the ATLAS experiment.
Figure 5.2 shows the \(p_{0}\) value as a function of the reconstructed Higgs mass from the ATLAS experiment.
5.2 Tables
The basic syntax for a table is:
Table: Approximate number of readout channels per sub-detector in ATLAS for the primary sub-detectors (ignoring the minbias trigger system, luminosity monitors, and DCS sensors) [@ATLAS_2008_The_ATLAS_Experiment_at_the_CERN_Large_Hadron]. {#tbl-atlas-channels}

| System                | Subsystem     |  Approx. channels |
|:----------------------|:--------------|------------------:|
| Inner detector        | Pixels        |              80 M |
|                       | SCT           |             6.3 M |
|                       | TRT           |             350 k |
| EM Calorimeter        | LAr barrel    |             110 k |
|                       | LAr end-cap   |              64 k |
| Hadronic Calorimeter  | Tile barrel   |             9.8 k |
|                       | LAr end-cap   |             5.6 k |
|                       | LAr forward   |             3.5 k |
| Muon spectrometer     | MDTs          |             350 k |
|                       | CSCs          |              31 k |
|                       | RPCs          |             370 k |
|                       | TGCs          |             320 k |
| Total                 |               |              88 M |
which produces:
| System | Subsystem | Approx. channels |
|---|---|---|
| Inner detector | Pixels | 80 M |
| SCT | 6.3 M | |
| TRT | 350 k | |
| EM Calorimeter | LAr barrel | 110 k |
| LAr end-cap | 64 k | |
| Hadronic Calorimeter | Tile barrel | 9.8 k |
| LAr end-cap | 5.6 k | |
| LAr forward | 3.5 k | |
| Muon spectrometer | MDTs | 350 k |
| CSCs | 31 k | |
| RPCs | 370 k | |
| TGCs | 320 k | |
| Total | 88 M |
Refer to tables like this:
@tbl-atlas-channels shows some cool things too.Table 5.1 shows some cool things too.
5.3 Callout blocks
This shows how to write callout blocks.
For example:
The lore of our fathers is a fabric of sentences. In our hands it develops and changes, through more or less arbitrary and deliberate revisions and additions of our own, more or less directly occasioned by the continuing stimulation of our sense organs. It is a pale grey lore, black with fact and white with convention. But I have found no substantial reasons for concluding that there are any quite black threads in it, or any white ones. 2
2 Quine (1960), p. 374.
And collapsed versions:
This is an example of a ‘folded’ caution callout that can be expanded by the user. You can use collapse="true" to collapse it by default or collapse="false" to make a collapsible callout that is expanded by default.
Lorem ipsum dolor sit amet, duo ut putant verear, nam ut brute utroque. Officiis qualisque conceptam te duo, eu vim soluta numquam, has ut aliquip accusamus. Probo aliquam pri id. Mutat singulis ad vis, eam euismod pertinax an, ea tale volumus vel. At porro soleat est. Debet facilis admodum an sed, at falli feugiat est.